Adlice (CDE) CrashDumpExtractor Premium 2.9.0.0 Multilingual
CrashDumpExtractor (CDE) is a software to help manage and categorize crash dumps from a monitored folder.
Display version information, stack trace (from given symbols), organize per bug and keep everything in a local database.

Why CDE ?
If you are a Windows software developer, and if your software is pretty popular, you probably know how hard it can be to fix bugs.
In Windows development, when an application crashes, it often generates what is called a "crash dump". This file contains all the information regarding the last instruction executed by the software that led to the crash. It contains also all the context (understand memory) at the moment of the crash. That information is gold for the developer because it's most of the time more than enough to fix the issue. If you have setup a policy to collect those crash dumps (upload form at restart) you now have a whole folder full of crash dumps waiting for analysis.
Here comes Adlice CDE. Give it a folder to analyse, configure the symbols server path and it will show you everything categorized by bug. You won't need to analyze dozens of crash dumps telling the same story, just one of each.
How it works :
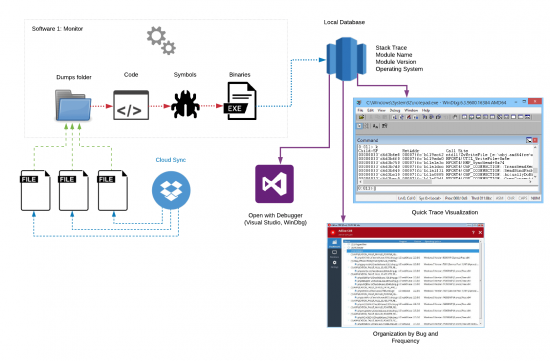
CDE uses one monitor per software and watches a folder for new dumps. This can be used with a cloud (Dropbox, Drive) to synchronize new crash dumps on a dev machine.
CDE will extract information from those dumps, classify them by "Bug ID" (this is a way to identify a bug) and display them in the interface. You can then open the dumps with default program (Visual Studio, Windbg, etc...) and remove it once the bug is fixed.
Featured ?
Parse crash dumps in either compressed (.tar.gz only) format or raw (MDMP) format.
Extract Program name, Program version, Operating System and stack trace (given symbols).
Monitor a folder for new dumps. They are automatically parsed/added when they arrive.
Display dumps in a "Bug Id" organized view, to better group same bugs.
Open a crash dump for analysis (with default program, can be Visual Studio, WindDBG).
Monitor multiple software, with different dumps folder, symbols and source code.
40MB
http://s15.alxa.net/001/05/Adlice_CD...um_2.9.0.0.rar
CrashDumpExtractor (CDE) is a software to help manage and categorize crash dumps from a monitored folder.
Display version information, stack trace (from given symbols), organize per bug and keep everything in a local database.

Why CDE ?
If you are a Windows software developer, and if your software is pretty popular, you probably know how hard it can be to fix bugs.
In Windows development, when an application crashes, it often generates what is called a "crash dump". This file contains all the information regarding the last instruction executed by the software that led to the crash. It contains also all the context (understand memory) at the moment of the crash. That information is gold for the developer because it's most of the time more than enough to fix the issue. If you have setup a policy to collect those crash dumps (upload form at restart) you now have a whole folder full of crash dumps waiting for analysis.
Here comes Adlice CDE. Give it a folder to analyse, configure the symbols server path and it will show you everything categorized by bug. You won't need to analyze dozens of crash dumps telling the same story, just one of each.
How it works :
CDE uses one monitor per software and watches a folder for new dumps. This can be used with a cloud (Dropbox, Drive) to synchronize new crash dumps on a dev machine.
CDE will extract information from those dumps, classify them by "Bug ID" (this is a way to identify a bug) and display them in the interface. You can then open the dumps with default program (Visual Studio, Windbg, etc...) and remove it once the bug is fixed.
Featured ?
Parse crash dumps in either compressed (.tar.gz only) format or raw (MDMP) format.
Extract Program name, Program version, Operating System and stack trace (given symbols).
Monitor a folder for new dumps. They are automatically parsed/added when they arrive.
Display dumps in a "Bug Id" organized view, to better group same bugs.
Open a crash dump for analysis (with default program, can be Visual Studio, WindDBG).
Monitor multiple software, with different dumps folder, symbols and source code.
40MB
http://s15.alxa.net/001/05/Adlice_CD...um_2.9.0.0.rar